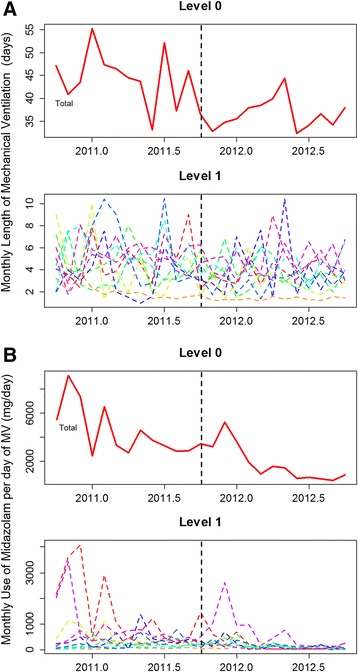
Figure 5.

Results from the hierarchical time series model. Length of mechanical ventilation (MV) (A) and adjusted midazolam consumption (B) over time. Level 0 denotes the modeled time series using a bottom-up method for the entire network. Level 1 denotes the independent time series for each of the ten units analyzed. Dashed black lines represent when the intervention began.
