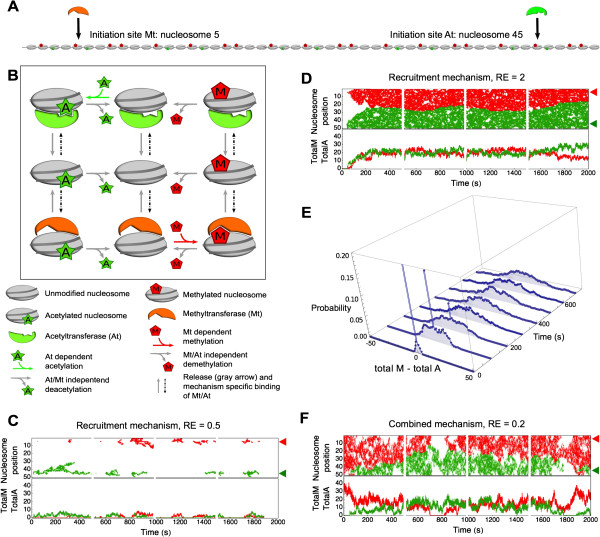
Figure 6.

Characteristics of opposing transferases and formation of a modification boundary. (A) On the nucleosomal array consisting of 50 nucleosomes both the methyltransferase (Mt) and acetyltransferase (At) have an initiation site, at nucleosome position 5 and 45, respectively. (B) With the introduction of the acetyltransferase to the system the acetylation reaction is changed into a transferase dependent reaction. The demodification reactions both remain transferase independent. Dashed arrows represent the binding of the transferase to the nucleosome. Transferase nucleosome binding is caused by transferase binding at the initiation site, by diffusion, or by the recruitment process (Figure 1C-E). Two transferases cannot bind to one nucleosome at the same time. A full list of model reactions can be found in Additional file 10: S5. (C-E) Each figure shows four simulations of 500 s as an illustration of the model behavior. Top panels show the position of the methylation (red) and acetylation (green) over time, initiation sites are indicated by red and green arrowheads. Bottom panels show the total amount of modifications on the array over time, corresponding to the top panels. The parameters used in these simulations are listed in Table 1, with k on = 0.1 s-1. Model behavior is shown for (C) the recruitment mechanism with low recruitment-efficiency (RE = 0.5; k recruitment =1.2 s-1) and (D) recruitment mechanism with high recruitment-efficiency (RE =2; k recruitment = 4.8 s-1). (E) This figure shows the boundary behavior of the recruitment mechanism shown in (D). Within intervals of 10 s the distributions of total methylated nucleosomes minus total acetylated nucleosomes is calculated over 450 simulations. Probability distributions of the intervals starting at 0 s, 100 s, 200 s, 300 s, 400 s, 500 s, 600 s, and 700 s are shown. (F) This figure shows model behavior of combined recruitment and diffusion mechanism with low recruitment-efficiency (RE = 0.2; k recruitment =0.48 s-1).
