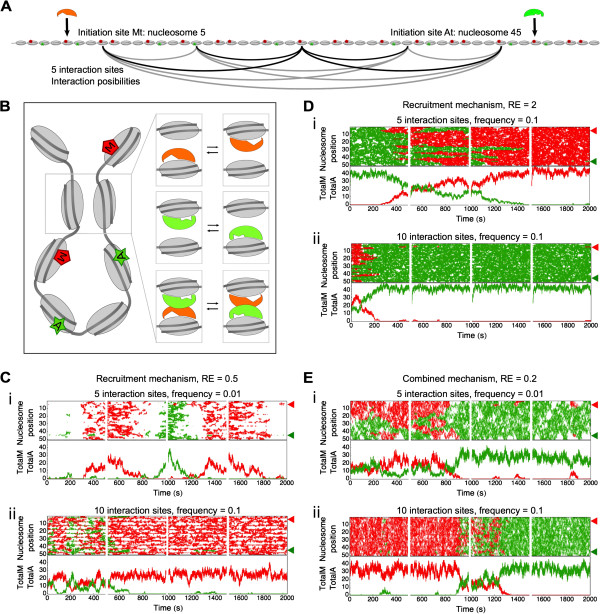
Figure 7.

The emergence of bistability by chromatin connectivity. (A) The figure represents an example of the nucleosomal array with five interaction sites, in which each interaction site is connected to all other interaction sites. (B) The cartoon illustrates that chromatin interactions are initiated when two non-adjacent nucleosomes are connected. If transferases are present on the nucleosomes they are able to hop to the connected nucleosome, or when two different transferases are present they can exchange positions, independent of the nucleosomal modification state (legend see Figure 6). (C-E) Each subfigure shows a row of four simulations of 500 s each as an illustration of the model behavior. Top panels show the position of the methylation (red) and acetylation (green) over time, initiation sites indicated by red and green arrowheads (on position 5 and 45, respectively). Bottom panels show the total amount of each modification over time, corresponding to the top panel. The parameters used in these simulations are listed in Table 1. (C) Simulation of the recruitment mechanism with recruitment-efficiency 0.5, k recruitment =1.2 s-1. (i) Intermediate connectivity, 10 interaction sites, k interaction =0.01 s-1, (ii) high connectivity, 10 interaction sites, k interaction =0.1 s-1. (E) Simulation of the recruitment mechanism with recruitment-efficiency 2, k recruitment =4.8 s-1. (ii) Intermediate connectivity, five interaction sites, k interaction =0.1 s-1, (ii) high connectivity, 10 interaction sites, k interaction =0.1 s-1. (D) Simulation of the combined mechanism with recruitment-efficiency 0.2, k recruitment =0.48 s-1. (ii) Intermediate connectivity, five interaction sites, k interaction =0.01 s-1, (ii) high connectivity, 10 interaction sites, k interaction =0.1 s-1. All mechanisms are simulated with two, three, five, and 10 interaction sites equidistant from each other and the border, at k interaction =0.01 s-1 and 0.1 s-1. The remainder of the graphs is shown in Additional file 5: Figure S1, Additional file 6: Figure S2, Additional file 7: Figure S3, Additional file 8: Figure S4, and Additional file 9: Figure S5.
