Figure 5.

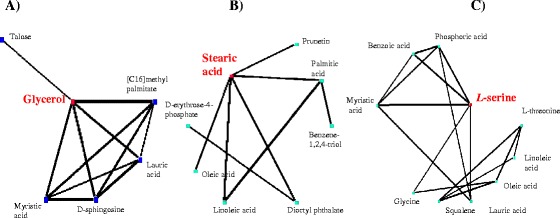
Hub metabolites and their metabolic profile as represented by node and edge graph. A) glycerol in module M1; B) stearic acid in module M2; C) L-serine in module M5.

Hub metabolites and their metabolic profile as represented by node and edge graph. A) glycerol in module M1; B) stearic acid in module M2; C) L-serine in module M5.