Fig. 1.

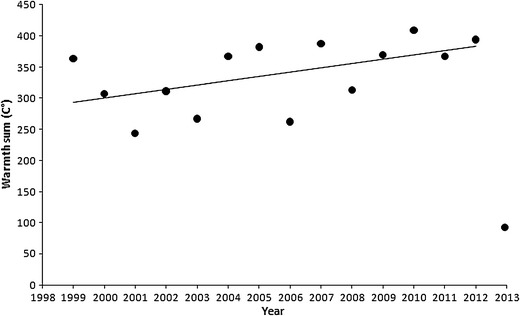
Warmth sums (sums of the daily maximum temperatures between 15 March and 15 April) by year for the period 1999–2013, including temporal trend line (excluding 2013)

Warmth sums (sums of the daily maximum temperatures between 15 March and 15 April) by year for the period 1999–2013, including temporal trend line (excluding 2013)