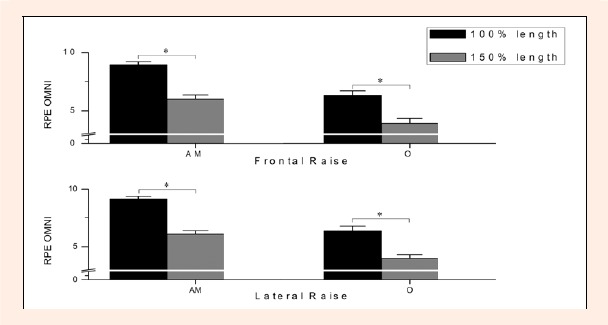
Figure 2.

Comparisons between intensities on the OMNI-RES with elastic band scores. The columns represent the mean and the error bars represent the standard error of the mean. AM = active muscles; O = overall body. * Indicates significant differences (p<0.05) between intensities.
