. 2014 Mar 25;9:41. doi: 10.1186/1750-1172-9-41
Copyright © 2014 Ranucci et al.; licensee BioMed Central Ltd.
This is an Open Access article distributed under the terms of the Creative Commons Attribution License (http://creativecommons.org/licenses/by/2.0), which permits unrestricted use, distribution, and reproduction in any medium, provided the original work is properly credited. The Creative Commons Public Domain Dedication waiver (http://creativecommons.org/publicdomain/zero/1.0/) applies to the data made available in this article, unless otherwise stated.
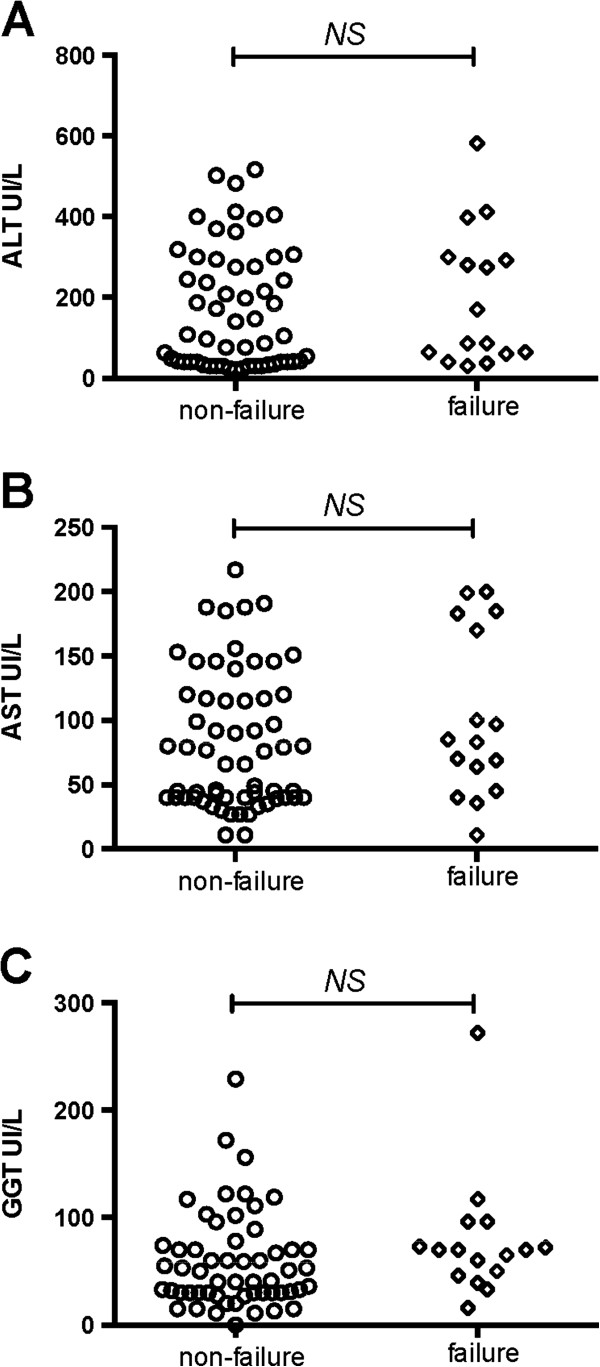
Figure 2.

Baseline ALT (A), AST (B) and GGT (C) levels in blocks with and without treatment failure.
