Figure 1.

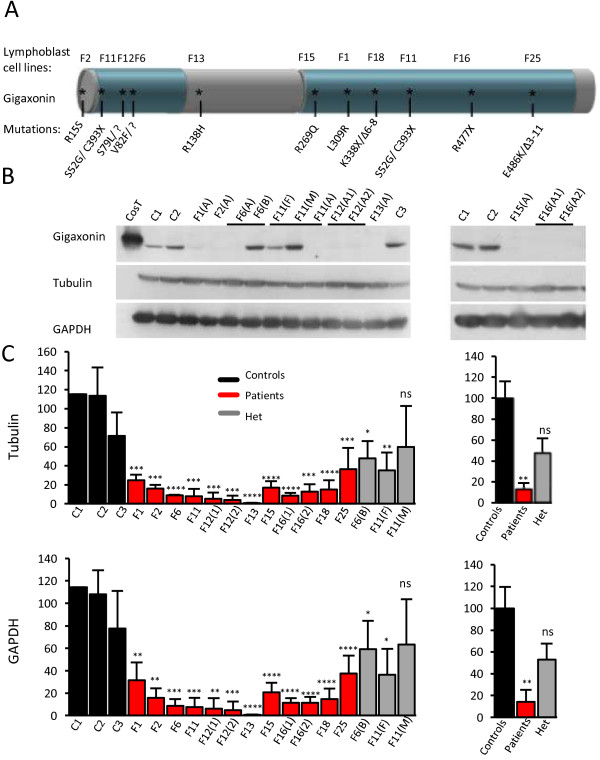
Decreased abundance of disease-associated Gigaxonin. A Schematic representation of Gigaxonin and the corresponding known mutations in GAN patients. The N-terminal BTB and C-terminal KELCH domains are represented in blue. Lymphoblast cell lines derived from GAN patients are numbered F1-F25 and their respective mutations are mapped on Gigaxonin. All patients are severely affected by the disease with the exception of patients F2 and F13, who are mild cases reported previously. B Abundance of Gigaxonin, as revealed by immunoblotting using the GigA antibody [8]. Cost and c1-c3 correspond to ectopic Flag-tagged Gigaxonin expressed in COS cells and to unrelated control individuals, respectively. (A), (B), (F) and (M) stand for Affected, non-affected Brother, Father and Mother, respectively. A1 and A2 are two affected children from the same family. Please note that immunoblottings of patients F18 and F25 are shown in Figure 2A. C Quantification of Gigaxonin in GAN patients and their relatives. Left: Percentage of Gigaxonin for each individual in comparison to wild type Gigaxonin, as the average of 3–5 independent experiments, after normalization with tubulin and GAPDH. Right: Mean abundance of Gigaxonin in patients and heterozygous individuals, as measured by the percentage in comparison to wild type Gigaxonin. (T-test, *, p < 0,05; **, p < 0,01, ***, p < 0,001 and ***, p < 0,0001; error bars represent standard deviation).
