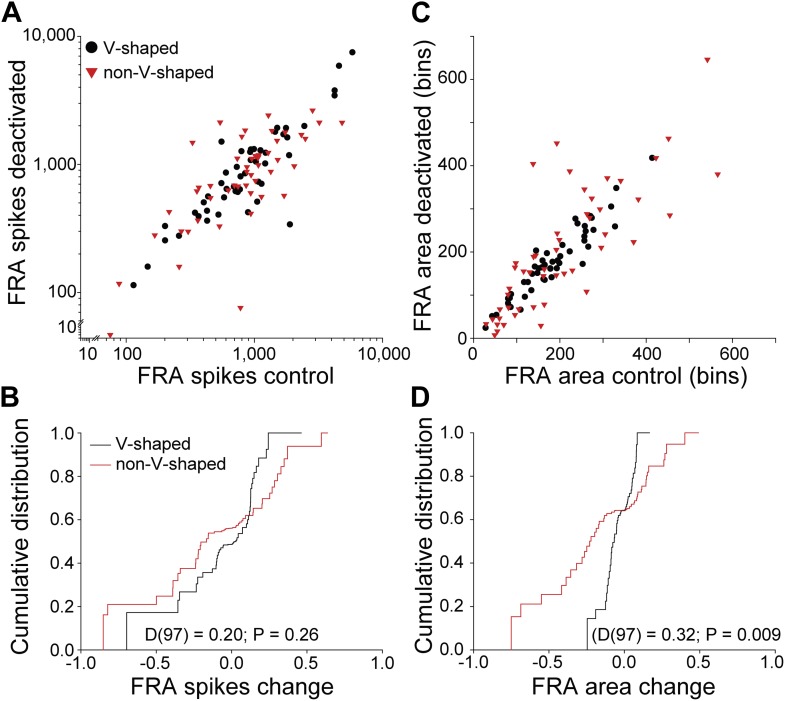
Figure 4. Differential changes in firing rate and receptive field area by FRA class.
(A) Total spikes in FRA on deactivation of the contralateral IC as a function of control value. A wide range of changes in firing rate were noted for both V and nonV receptive field classes with deactivation. (B) Cumulative distribution of change index (see text) for total spikes showing a similar range and distribution for V and nonV FRAs. (C) Receptive field area on deactivation as a function of control. (D) Cumulative distributions of change index of FRA area. The range of area change for nonV units was three times greater than for those with V response areas.

