
Figure 3.
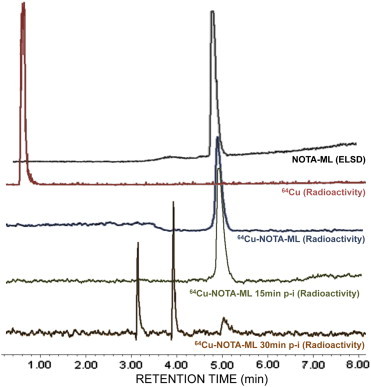
Radiolabeled peptide integrity analysis in vivo. UPLC analysis showing ELSD chromatogram for pure unlabeled compound (black trace) and radiometric profiles of free 64Cu (red) and radiolabeled compound after labeling (blue). The chromatograms of plasma taken from mice 15 minutes (green) and 30 minutes (orange) post-injection are also shown.