
Figure 1.
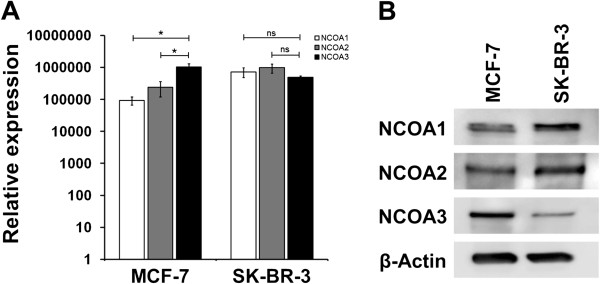
Expression of NCOA1, 2 and 3 in ERα-positive MCF-7 and ERα-negative SK-BR-3 breast cancer cells. (A) Real-time RT-PCR quantification of NCOA1, 2 and 3 mRNA expression in MCF-7 and SK-BR-3 breast cancer cells. Shown are mean and standard deviation of three individual experiments. Statistical analysis of NCOA3 mRNA expression compared to NCOA1 and 2 were performed using two-tailed Student’s t-test. P-values ≤ 0.05 (*) were considered statistically significant. (B) Protein expression of NCOA1, 2 and 3 in MCF-7 and SK-BR-3 breast cancer cells was analyzed by Western blot. β-actin was used as a loading control.