Figure 2.

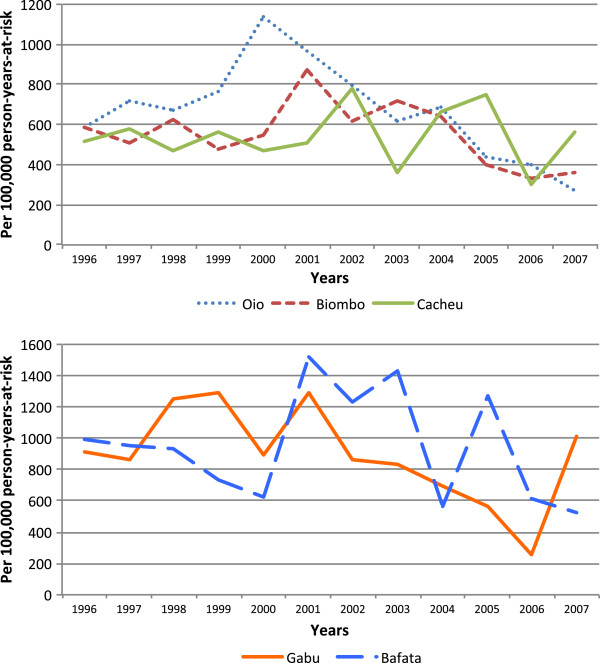
Trends in mortality of women of reproductive age by region, 1996–2007. Hazard mortality rates per 100,000 person-years-at-risk by northern (Biombo, Cacheu and Oio) and eastern (Bafata and Gabu) regions are presented.

Trends in mortality of women of reproductive age by region, 1996–2007. Hazard mortality rates per 100,000 person-years-at-risk by northern (Biombo, Cacheu and Oio) and eastern (Bafata and Gabu) regions are presented.