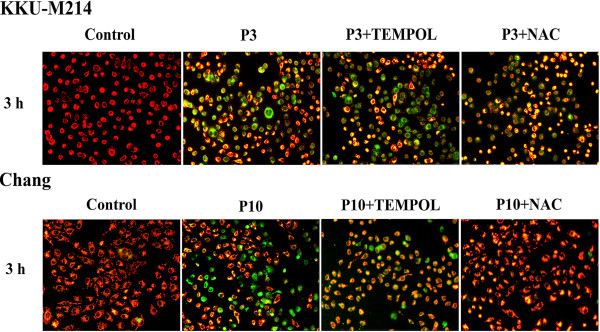
Figure 7.

PEITC-induced depolarization of the mitochondrial transmembrane potential. Cells were treated with 3 or 10 μM (P3 or P10) of PEITC with TEMPOL (0.5 mM TEM) or NAC (2 mM NAC) for 3 h. The change in ΔΨm was examined using JC-1 staining method. Fluorescent images were captured by fluorescence microscopy with the excitation wavelength of 485 nm and the emission wavelength of 535 nm. The experiments were performed twice with similar results, representative images from one experiment were shown.
