
Figure 3.
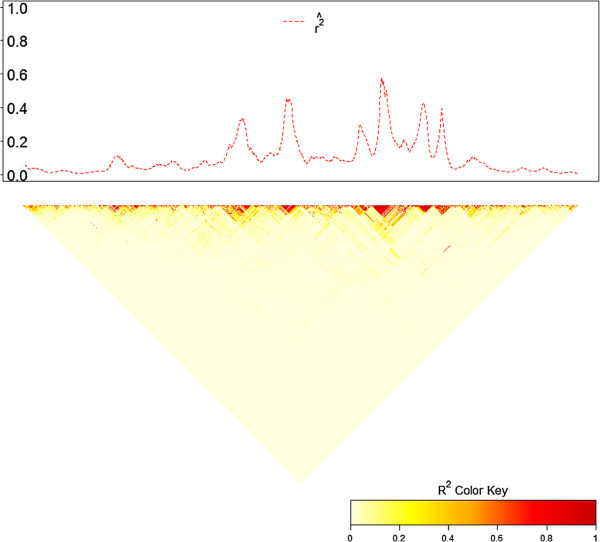
Comparison of the local LD map with heatmap for Chromosome 1, Duroc. The upper plot shows how expected r2, estimated by substituting and 10 Mb in Equation 4, varies along chromosome. Sliding window size N = 100. The lower plot is a triangular heatmap, which presents higher LD in darker graphical color blocks.