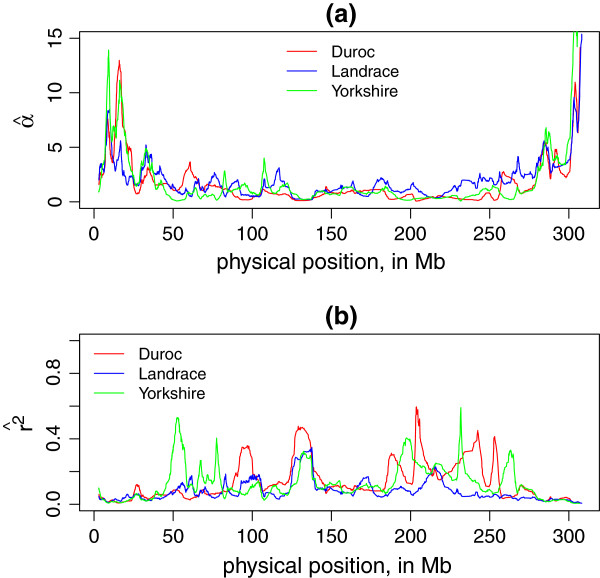
Figure 4.

Local LD decay rate () and LD (r2) along Chromosome 1 for three breeds. (a) is for each sliding window plotted against the physical position (in Mb) of the middle point SNP in this window, and (b) is the expected estimated by and d = 10 Mb plotted against middle point SNP position (in Mb). The sliding window size N = 100.
