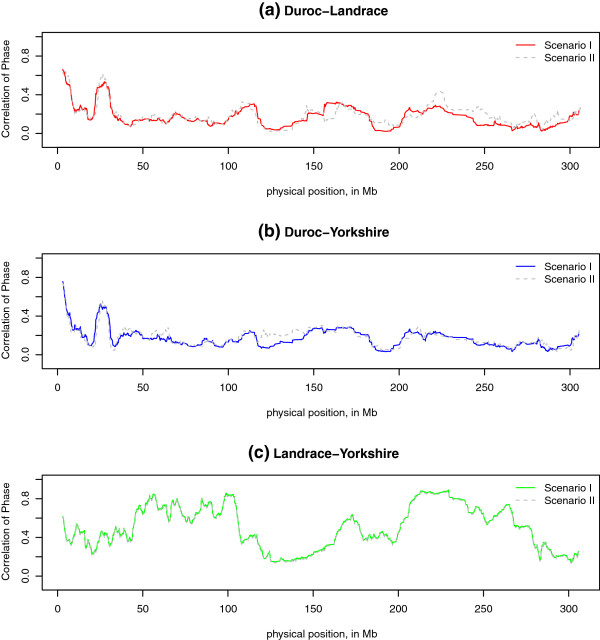
Figure 8.

Comparison of the local persistence of phase between two scenarios for each pair of breeds on Chromosome 1. The figures show the difference in the correlation of phase calculated by different common SNP sets: solid lines under Scenario I only included common SNPs for all three breeds, and grey dashed lines under Scenario II included common markers between pair breeds which were not included in the third breed.
