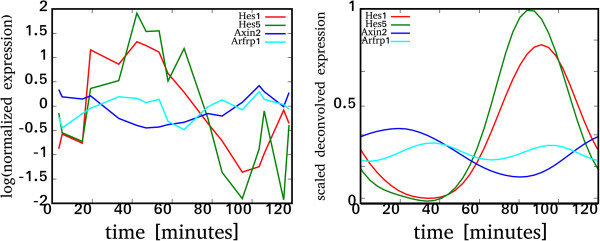
Figure 2.

Original measurements (left) and deconvolved (right) profiles forHes1,Axin2,Hes5andArfrp1. The bimodal expression profile of Arfrp1 shows distinct expression peaks in opposite phases of the somite cycle. The measurements are taken as the average of the posterior half of the PSM, while the reconstructed, deconvolved profile represents the gene expression at the embryo’s tail, hence the overall shift in expression times.
