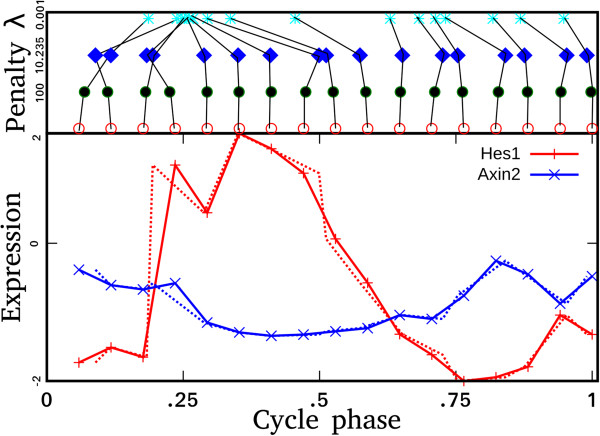
Figure 4.

Optimization of positioning of experiments along the somite cycle. Bottom panel: The temporal profiles of Hes1 and Axin2 plotted against original (solid lines) and optimized time points (dotted lines). Top panel: The result depends on the choice of the amount of allowed variation during optimization of timepoints (see Methods). The allowed variation depends on the value of weight penalty λ in Eq. 2. Higher values of λ will overemphasize the regulation leading to the reconstruction of the original points while too small values will overweight the goodness-of-fit component leading to a poor regulation. The value 10.2 (in the mouse-1 dataset) was found to be a good consensus, giving high periodicity scores without sacrificing the global properties of the profiles.
