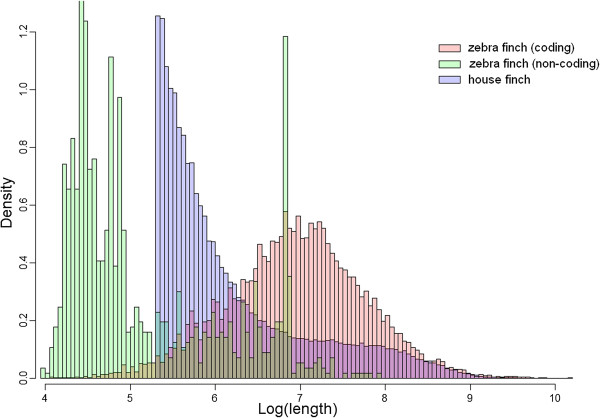
Figure 2.

Distribution of zebra finch coding (pink bars) and non-coding (green bars) transcript lengths and house finch transcript lengths (blue bars) after applying the cut-off threshold of 462 bp for including a house finch transcript in the data set. In general, non-coding transcripts are shorter than coding transcript, but we also observe a spike around 1000 bp in the zebra finch non-coding transcripts, which may represent long non-coding RNAs.
