
Figure 2.
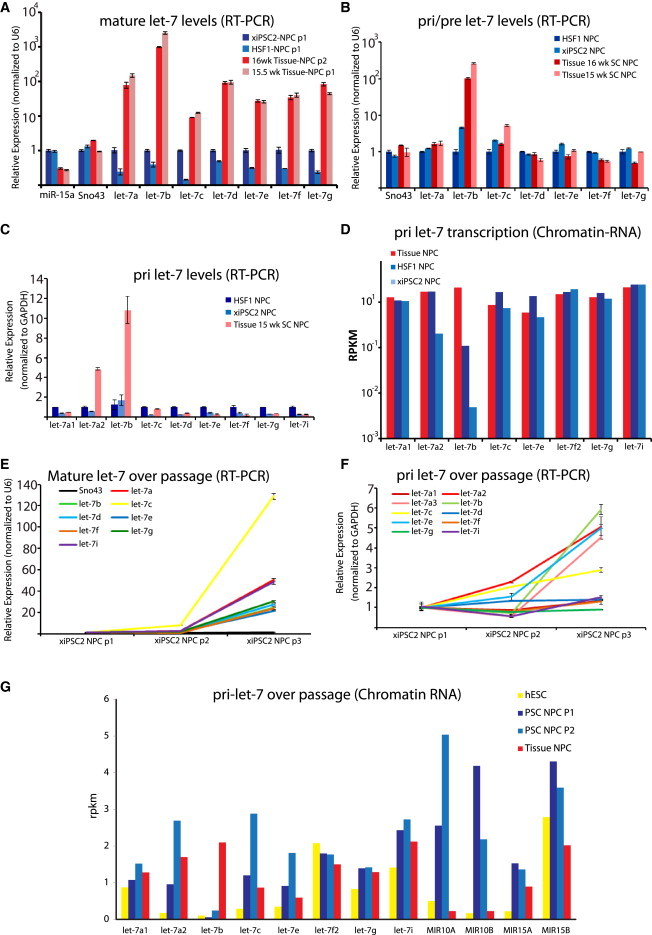
Dynamics of let-7 Expression and Processing between PSC-NPCs and Tissue-NPCs
(A) RT-PCR for mature let-7 family members normalized against small nucleolar RNA U6 in two PSC-NPCs and two Tissue-NPCs. miR-15a and Sno43 were assayed as controls.
(B) Real-time RT-PCR for pre and pri let-7 family members normalized against small nucleolar RNA U6.
(C) Real-time RT-PCR for pri-let-7 miRNAs normalized against the relative levels of GAPDH in each cell type.
(D) miRNA-seq of chromatin-associated primary let-7 family miRNA transcripts between PSC-NPCs and Tissue-NPCs displayed as reads per kilobase measured (RPKM).
(E) Real-time RT-PCR for mature let-7 family miRNAs in PSC-NPCs over three passages normalized against U6. Sno43 was run as a negative control and was unchanged over passage.
(F) Real-time RT-PCR for primary let-7 family miRNA transcripts in PSC-NPCs over three passages normalized against U6.
(G) miRNA-seq of chromatin-associated primary let-7 family miRNA transcripts in PSC-NPCs over two passages (n = 2 for each group) displayed as reads per kilobase measured (RPKM). Data for miRs-10a, 10b, 15a, and 15b are shown to indicate that let-7 transcriptional regulation is unique in PSC versus Tissue-NPCs, even over passage, where let-7a1, a2, b, c, and e were induced. Error bars in all RT-PCR graphs represent SEM over three to four technical replicates, and results shown are representative of at least three independent experiments.