
Figure 4.
Direct Introduction of let-7 miRNAs Affects Developmental Progression of PSC-NPCs
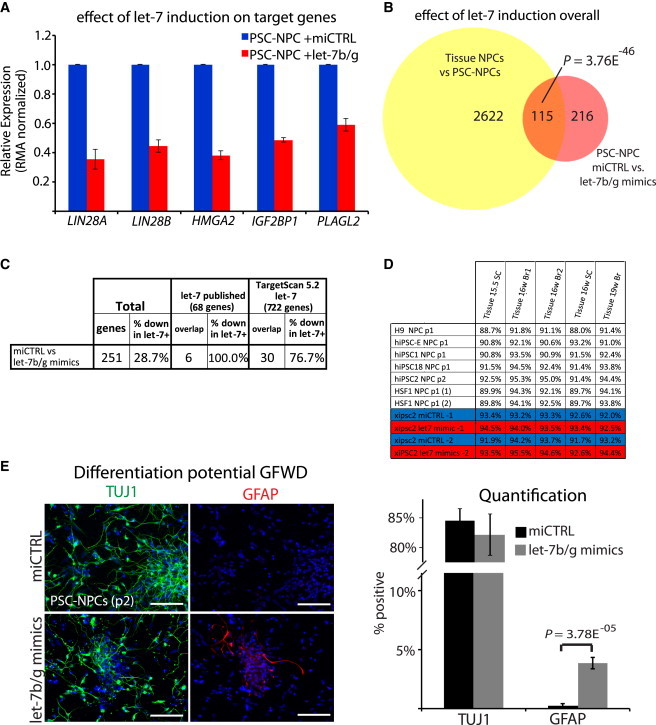
(A) Averaged RMA normalized expression of selected let-7 target genes in PSC-NPCs transfected with let-7b/g mimics or nontargeted control miRNAs by gene expression microarray. Error bars represent SEM across two biological replicates.
(B) Venn diagram demonstrating the original differences identified by Patterson et al. (2012) (yellow), and the overlap with gene expression differences (>1.54-fold change) between let-7b/g mimics versus nonspecific control (miCTRL) in PSC-NPCs (red; n = 2).
(C) Overlap of published and predicted let-7 targets with genes changed after transfection of PSC-NPCs with let-7b/g mimics or nontargeted control miRNAs measured by gene expression microarray.
(D) Pearson correlations of global gene expression similarity between PSC-NPCs, PSC-NPCs transfected with let-7b/g mimics or nontargeted control miRNAs, and Tissue-NPCs.
(E) Immunofluorescence (left) and quantification (right) for TUJ1 (neurons) and GFAP (glia) on PSC-NPCs differentiated for 3 weeks in growth factor withdrawal following transfection with let-7b/g mimics or miCTRL. p value indicated reflects Student’s t test for at least 800 cells in multiple wells and across six fields of view. Error bars represent SEM over fields of view, and results shown are representative of at least three independent experiments. Scale bar, 100 μm.