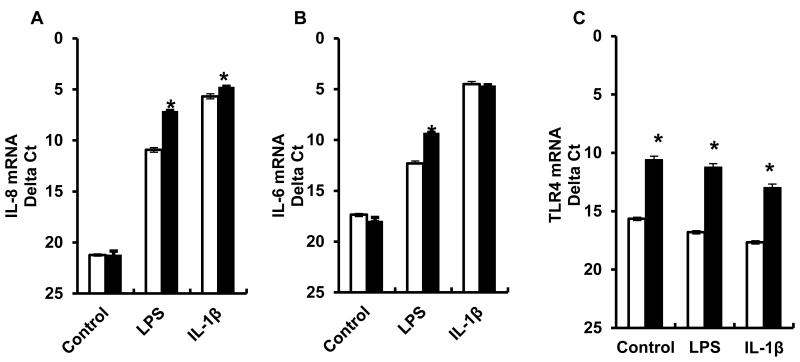
Figure 3.
Expression of IL-8 (A), IL-6 (B) and TLR4 (C) mRNA in the low responding (LRarray) and the high responding (HRarray) fibroblast cultures that were exposed to either media alone, LPS (100 ng/mL), or IL-1β (10 ng/mL) for 8 h. Results are from three replicates of cryopreserved cells/cow thawed on separate days (Mean ± S.E.). *P < 0.05 LR vs. HR.

