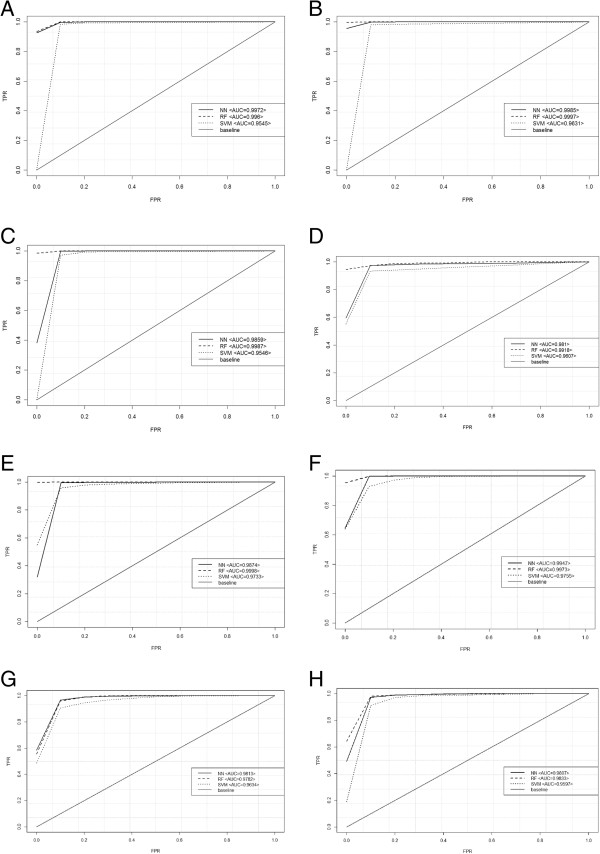
Figure 4.

ROC Curves. Comparison of different classifiers in each RNA-seq transcriptome profile by ROC curves. We used the ROC Curve analysis to compare the accuracy of the three classification models trained, every time, on a set of different, confirmed OPs/NOPs in PG1 (A), in PG2 (B), in PG3 (C) in HS2336 (D), in EC1 (E), in EC2 (F), in SE1 (G) and in SE2 (H).
