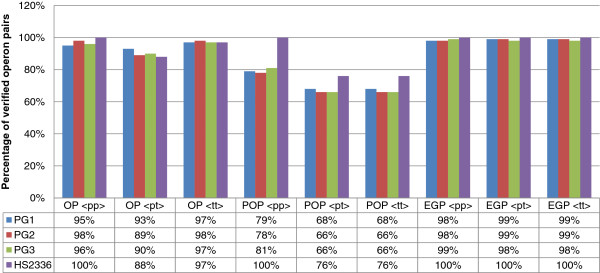
Figure 6.

OP control signals. Bar plots of the percentages of control signals identified in gene pairs that have been predicted as OPs by our classification system in H. somni and P. gingivalis. The percentages are reported for each used prediction program: PromPredict < pp>, Pepper Toolbox < pt > and TransTerm < tt > .
