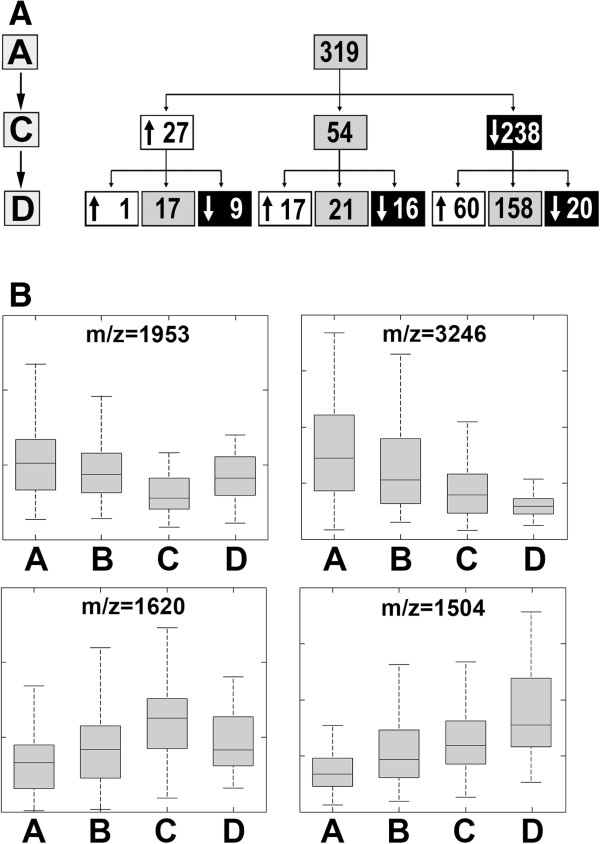
Figure 2.

Radiotherapy-related changes in patterns of serum proteome features. Panel A – The numbers of spectral components that followed particular patterns of changes between analyzed time points (either decrease and increase marked with corresponding arrows, or lack of statistically significant differences). Panel B – Examples of registered peptide ions that represented four specific patterns of changes; boxplots show: minimum, lower quartile, median, upper quartile and maximum values.
