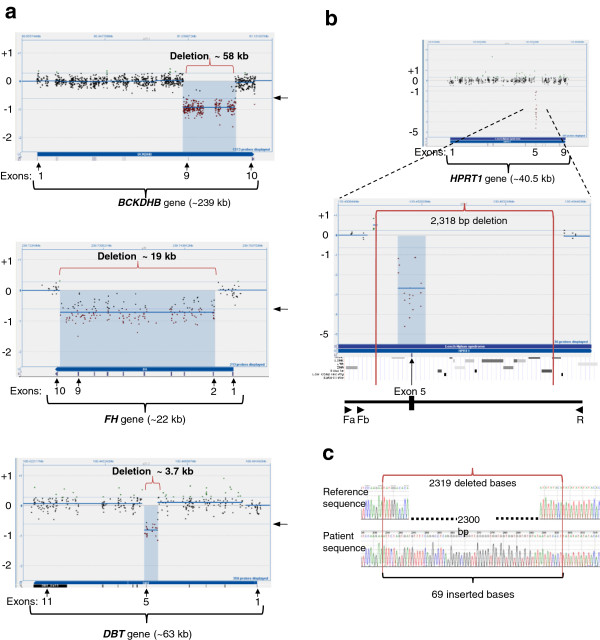
Figure 1.

Examples of large deletions (>2 kb). CytoSure display of aCGH data across genes, with exon locations marked below. The patient versus reference Cy3/Cy5 ratio is plotted for each sample. Shown are the mean of the log2 ratio (thick blue horizontal line) and thresholds for deletion and duplication calls at log2 ratios of +0.4 and -0.6, respectively (thin blue horizontal lines), derived from the CBS algorithm. Arrows on the right of the CytoSure display mark the -0.6 log2 threshold for deletions. Below the CytoSure display are the corresponding exon tracks. 1a top) ~58-kb deletion encompassing exon 9 of the BCKDHB gene. 1a middle) ~19-kb deletion encompassing exons 2–9 of the FH gene. 1a bottom) ~3.7-kb deletion encompassing exon 5 of the DBT gene. 1b) 2,318-bp deletion encompassing exon 5 of the HPRT1 gene. The breakpoints of the deletion are shown with vertical red lines. Below the CytoSure display are the UCSC RepeatMasker track showing repeat elements at the deletion locus, followed by an illustration of the breakpoint PCR design with location of primers (Fa, Fb, and R) shown as arrows. 1c) Electropherogram of sequenced HPRT1 deleted allele with 69 inserted bases shown. Image in Figure 1c was reproduced, with kind permission of Springer Science + Business Media, as previously published in Molecular Genetics and Personalized Medicine, edited by Best DH and Swensen JJ, Jan 2012, Chapter 2: Array Comparative Genomic Hybridization in Cytogenetics and Molecular Genetics, Askree SH and Hegde M, Figure 2.5, Page 32.
