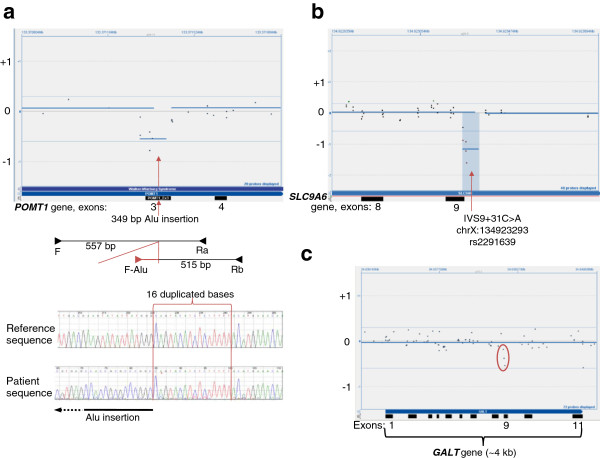
Figure 5.

False deletion calls. Figure5 shows CytoSure display of three independent sets of aCGH data, where probe hybridizations on three separate genes resulted in false deletion calls. 5a) Zoomed-in view of the POMT1 gene, where red arrow marks the breakpoint in exon 3, where an Alu insertion interrupts probe hybridization. Below the CytoSure view is an illustration of the breakpoint PCR design, with the location of primers shown as arrows. At the bottom is an electropherogram of the allele with the Alu inserted. The 16 bases, duplicated in the two ends of the inserted element, are shown within two vertical red lines. 5b) Zoomed-in view of the SLC9A6 gene, where red arrow marks the location of a SNP in intron 9 that is targeted by all the probes that triggered the false deletion call. 5c) The entire GALT gene, with three probes showing slightly poor hybridization due to compound heterozygous missense changes.
