
Figure 3.
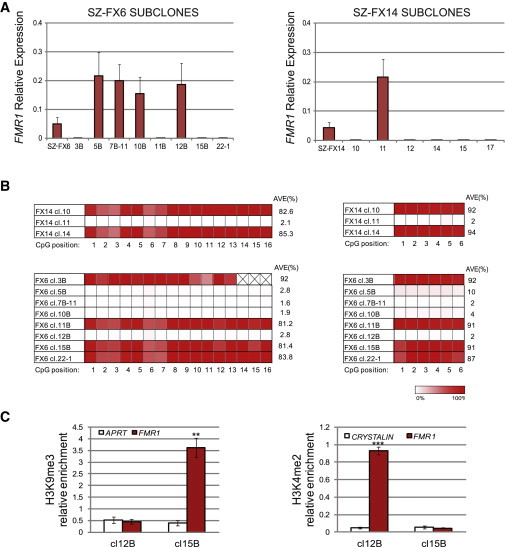
FMR1 Transcription, Methylation Levels and Histone Modifications in Subclones of FXS HESCs
(A) Mean relative FMR1 transcription levels of subclones from SZ-FX6 (left) and SZ-FX14 (right). Two independent qRT-PCR experiments were performed on a single passage culture. Ct values were normalized to the corresponding Ct value of GAPDH. Error bars represent standard error.
(B) Bisufite pyrosequencing for methylation levels near the CGGs (5′ left and 3′ right) in several of FXS HESC (SZ-FX6 and SZ-FX14) subclones.
(C) Real-time PCR ChIP analysis of H3K9me3 and H3K4me2 immediately upstream to the CGGs, in hypomethylated (SZ-FX6 cl.12B) versus hypermethylated (SZ-FX6 cl.15B) isogenic subclones. APRT and CRYSTALIN were used as negative controls for H3K9me3 and H3K4me2, respectively. The data in each panel represent an average of three to five independent ChIP experiments (paired t test, ∗∗p < 0.01, ∗∗∗p < 0.001). Error bars represent standard error.