
Figure 2.
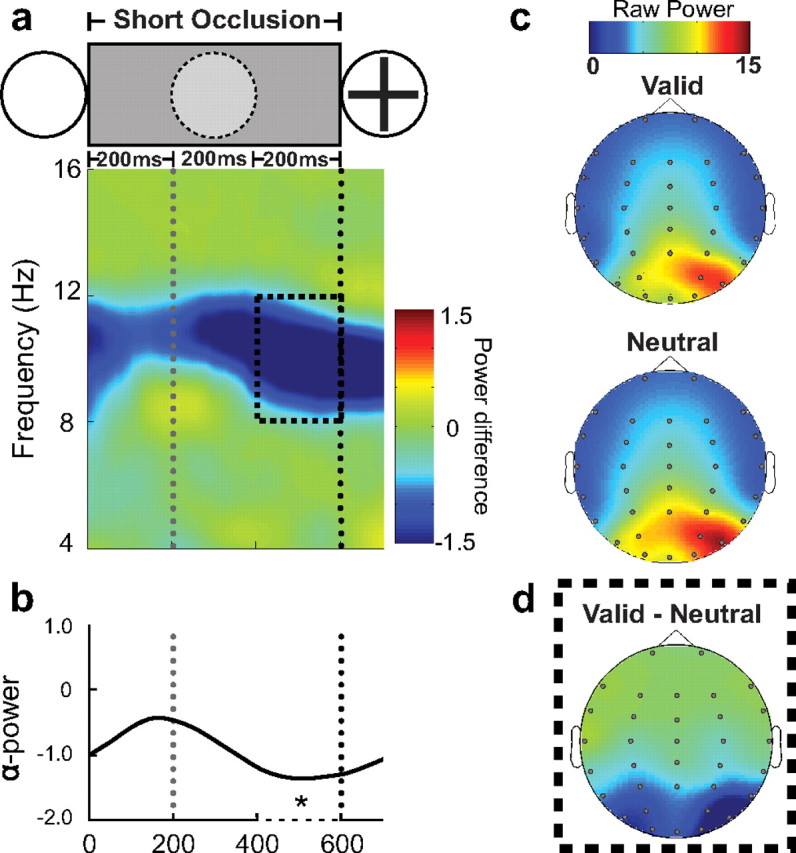
Alpha activity during the short occlusion period. The figure shows the alpha-band desynchronization in the valid, rhythmic condition relative to the neutral, arrhythmic condition for short-occlusion trials [Valid − Neutral]. The gray doted line shows the time that the occluded stimulus would be presented. The black doted line indicates the onset of the target. a, Color map of the frequency amplitude between 4 and 16 Hz after subtraction of the neutral (i.e., arrhythmic) from the valid (i.e., rhythmic) conditions. Black dashed box shows the time and frequency of interest analyzed. b, Lines showing the average of alpha power during the short occlusion period. c, Topographies showing the scalp distribution of raw alpha power (8–12 Hz) preceding target presentation (200 before target onset) for the valid, neutral conditions. d, Topography of alpha desynchronization of the difference between valid and neutral conditions.