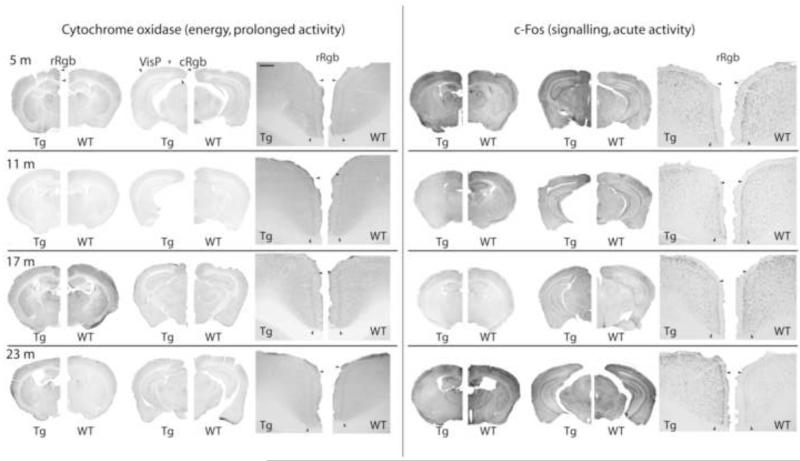
Figure 2. Effect of ageing on activity markers in Tg2576 mice.
Neural reactivity is indicated by c-Fos immediate-early gene induction, and energy metabolism with cytochrome oxidase. For each marker, a representative photomontage demonstrates the pattern of labeling, while a 5× photomicrograph presents specifically the progression of pathology in the retrosplenial cortex (rostral). Note that for the quantification of the intensity of cytochrome oxidase activity, optical densities are normalized to adjacent white matter, while c-Fos cell quantification is based on an intensity threshold from background levels to reduce inherent batch variability. Visual comparisons are done within-age groups, statistical analyses being based on normalized values, as described in the methodology. Arrowheads indicate the limit of the rostral and caudal granular b retrosplenial cortex (r- and cRgb), including the boundary between superficial and deep laminae, as well as that of the primary visual cortex (VisP). Scale bars = 200 μm.

