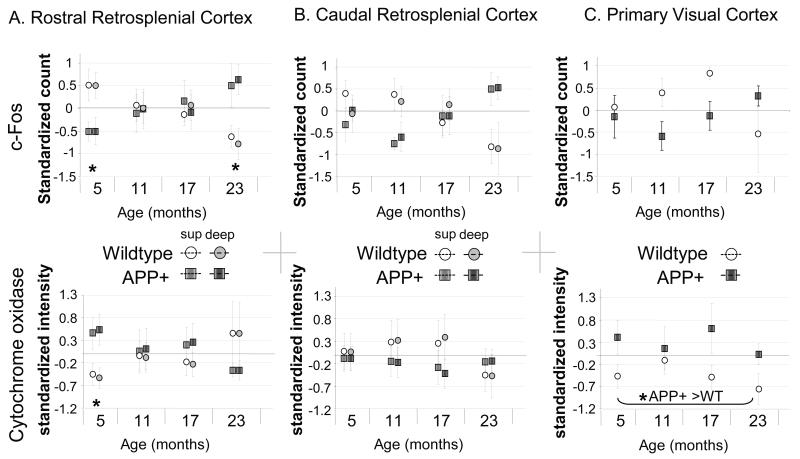
Figure 4. Histograms of cellular activity markers for wildtype and transgenic APP+ mice across age groups.
Cytochrome oxidase and c-Fos were both only altered for rostral Rgb at 5 months (top left panel). In addition to being reduced at 5 months, c-Fos induction was greater than wildtype mice at 23 months. The primary visual cortex exhibited chronic hypermetabolism. Errors bars represent the standard error of the mean. * p < 0.05.

