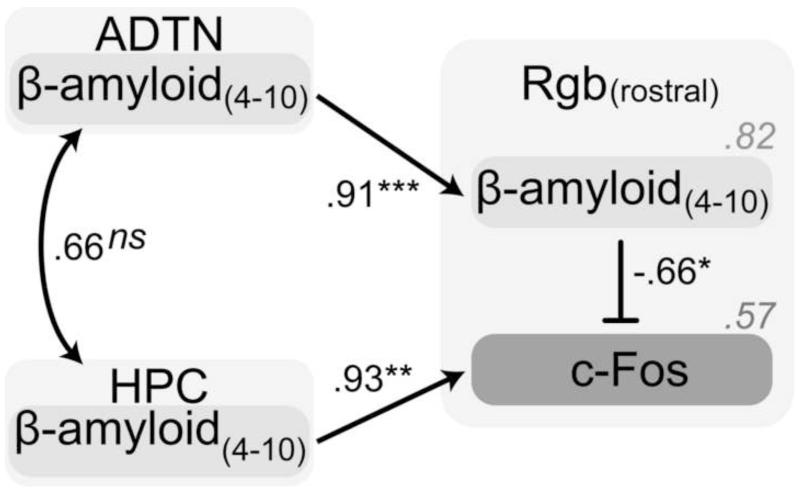
Figure 6. Statistical path analyses for the evaluation of the influence of intrinsic and extrinsic sources of early APP(swe)-related pathology [W0-2, β-amyloid(4-10)] on retrosplenial cortex dysfunction (c-Fos) at 5 months.
Anterior thalamus W0-2 seems related to that found in the retrosplenial cortex, which in turn affects c-Fos induction. In contrast, rostral hippocampal W0-2 itself is only a good predictor of retrosplenial cortex c-Fos activity. The blunt arrow represents inhibition while normal arrows represent increase/activation. Italicized values represent the coefficient of determination, a value representing the amount of variance accounted for by the explanatory variables. ADTN, anterior thalamic nuclei; HPC, hippocampus; Rgb, retrosplenial granular b. *, p < 0.05; **, p < 0.005; ***, p < 0.001; ns, non-significant (p > 0.12).

