Figure 3.
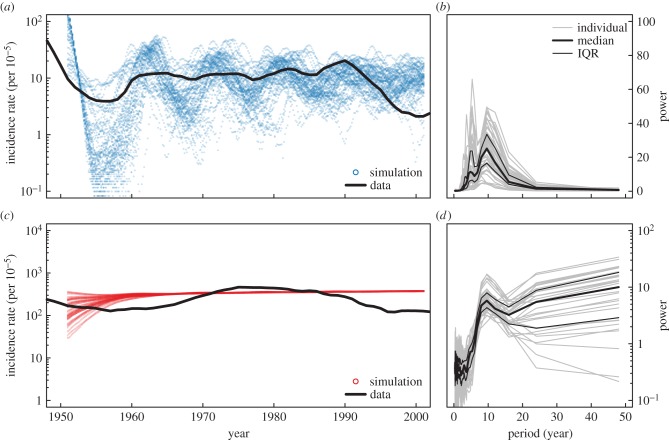
(a) Simulated syphilis and (b) gonorrhea dynamics. (a,c) Show 50 simulated syphilis and gonorrhea incidence (per 100 000 points) and observed national data (lines). (b,d) Show the Fourier power spectra of the simulated time series. Following Grassly et al. [1], we take the first difference of our time series before calculating the spectral density with Daniell smoothers of 3 years. For simulated data, we remove the first 5 years of the time series to allow for stochastic burn-in and let the contact network stabilize. For the mean-field approximations, Fourier transforms were taken on the undifferenced time series as the ODEs are smooth and oscillate around a stable mean. Thick lines report the median power, and thin the IQR. Dynamics are similar to observed incidence in US cities. Note, for gonorrhea, the dominant contributions to the power spectra are longer than the observed data window (50 years). The model uses PA and parameters were chosen to reproduce the prevalence and periodicity observed in the data assuming a 79 days average recovery period for syphilis. Full parameters: link creation rate (ρ) = 1/10 yr−1, disconnection rate (γ) = 1/158 d−1, transmissibility (β) = 1/53 d−1, recovery rate (r) = 1/79 d−1 (syphilis), 1/6.5 yr−1 (gonorrhea). Thus, the behavioural parameters reproducing the periodicity were found to be an average disconnection period of the order of five months and an average delay for new connections of the order of 5 years (with wide variations). (Online version in colour.)

