
Figure 4.
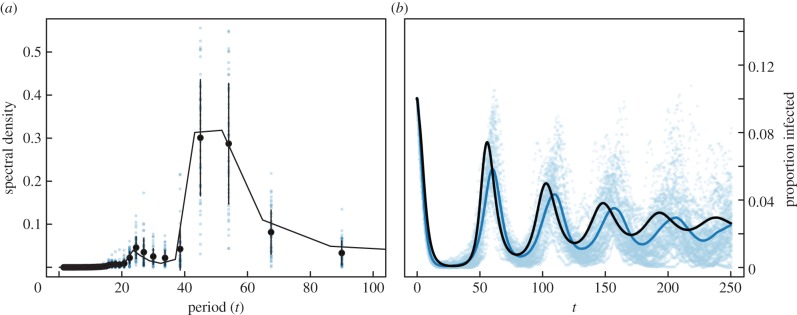
Periodicity in the simulated model and in the heterogeneous mean-field approximations (a) Fourier transform of the simulated and integrated time series. The big markers represent the average spectral density for the 50 time series shown on the left side, with error bars consisting of 1 s.d. and outliers shown with smaller markers. The solid line is the spectral density of the Fourier transform of the integrated analytical model. (b) Time evolution of the model without PA and with r = 1, β = 2/3, ρ = 1/50 and γ = 1/2. The dynamics start with an initially exponential degree distribution {pk} (mean degree 〈k〉 = 1.8087) and an initial infection Ik(0) = pk/10 for I(0) = ∑kIk(0) = 1/10. The points represent the 50 first time series obtained by Monte Carlo simulation on networks of size 20 000, while the average of 500 such time series is represented by the shaded curve. The black curve is the integration of our model. (Online version in colour.)