
Figure 6.
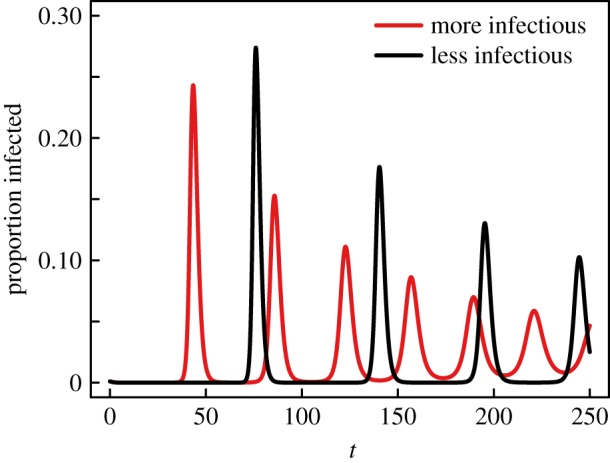
Smaller transmissibility leads to rarer, but larger outbreaks. Epidemic re-emergence obtained through integration of the model for two similar diseases on a network where all nodes are initially of degree 4 and of which a fraction 0.001 is infectious. For the red curve, the dynamics use r = 1, β = 3/10, ρ = 1/10 and γ = 17/14. For the black curve, the dynamics are almost identical, but slightly less transmissible: using β = 2/10. Both cases consider uniform attachment.