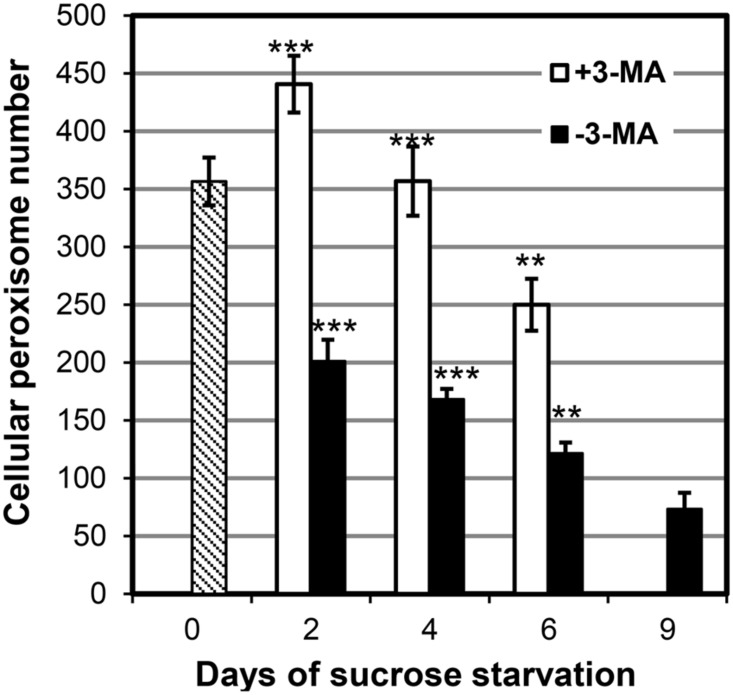
FIGURE 5.
Quantification of peroxisome dynamics in BY-2 EYFP-SKL cells under sucrose starvation by CLSM in the absence or presence of 3-MA. Data from one representative experiment are shown. For each time point, 10–18 individual cells were analyzed. Mean values of peroxisome numbers per cell ± SE are shown. Stars indicate significant differences between –3-MA and +3-MA samples at the same timepoint (***p < 0.0001, **p < 0.001).

