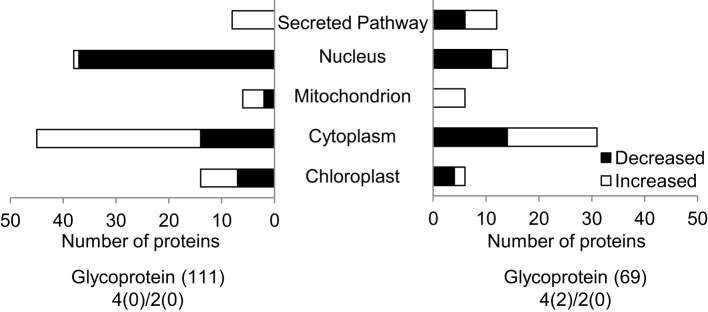
Figure 3.

Subcellular localization of the identified glycoproteins. Wolf PSORT and TargetP were used to predict the subcellular localization of the identified glycoproteins. The X-axis indicates the number of identified proteins. Filled bars and open bars indicate glycoproteins whose accumulation levels increased and decreased in soybean roots under flooding stress, respectively.
