Figure 4.

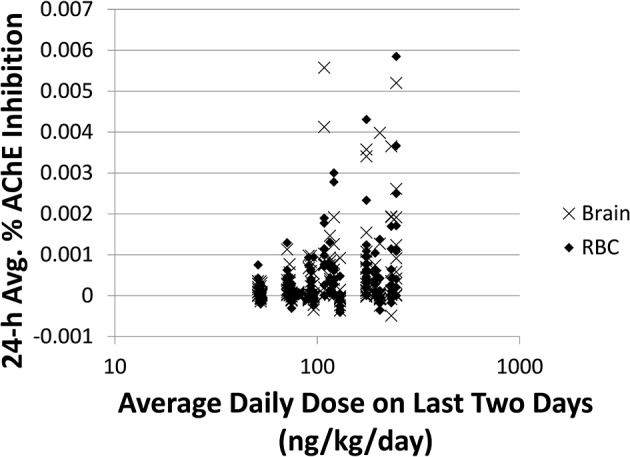
Time-averaged (over 24 h) % AChE inhibition for brain (x) and RBC (♦) vs. average daily doses ≥50 ng/kg/day from the last 2 days for 5000 simulations. For brain: slope = 0.0012, R2 = 0.089. For RBC: slope = 0.0011, R2 = 0.096.

Time-averaged (over 24 h) % AChE inhibition for brain (x) and RBC (♦) vs. average daily doses ≥50 ng/kg/day from the last 2 days for 5000 simulations. For brain: slope = 0.0012, R2 = 0.089. For RBC: slope = 0.0011, R2 = 0.096.