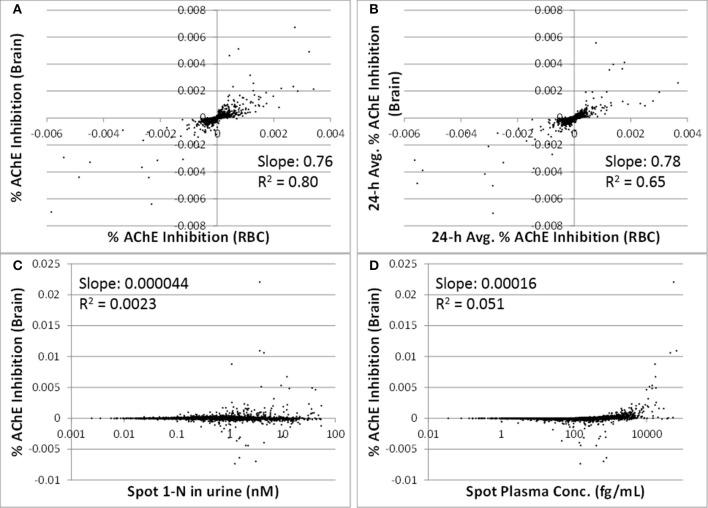
Figure 5.
Utility of peripheral markers to predict inhibition in the target tissue (brain) for 5000 simulations. (A) Spot percent AChE inhibition in the brain vs. spot percent AChE inhibition in red blood cells, taken at the same time as the urine sampling; (B) 24-h averaged AChE inhibition in brain vs. 24-h averaged AChE inhibition in RBC (time averaging was over the 24 h prior to urine sampling); (C) Spot percent AChE inhibition in the brain vs. spot 1-N concentrations in urine (nM); (D) Spot percent AChE inhibition in the brain vs. spot carbaryl concentrations in plasma (pM).

