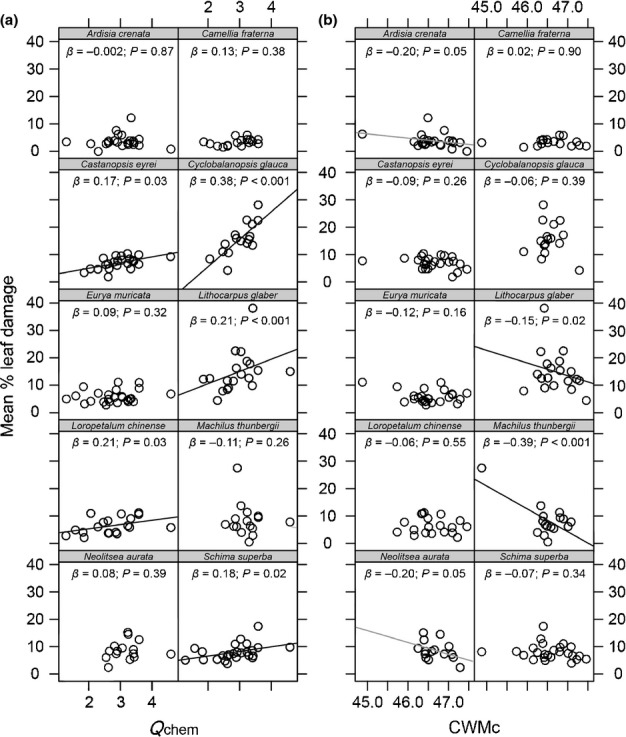
Figure 2.

Relationships between herbivore damage of the single study species and (a) chemical leaf trait diversity (Qchem) and (b) community-weighted mean leaf C values (CWMC) (with regression slopes β and their probabilities P). Black lines indicate significant, gray lines close to significant relationships.
