FIGURE 4.

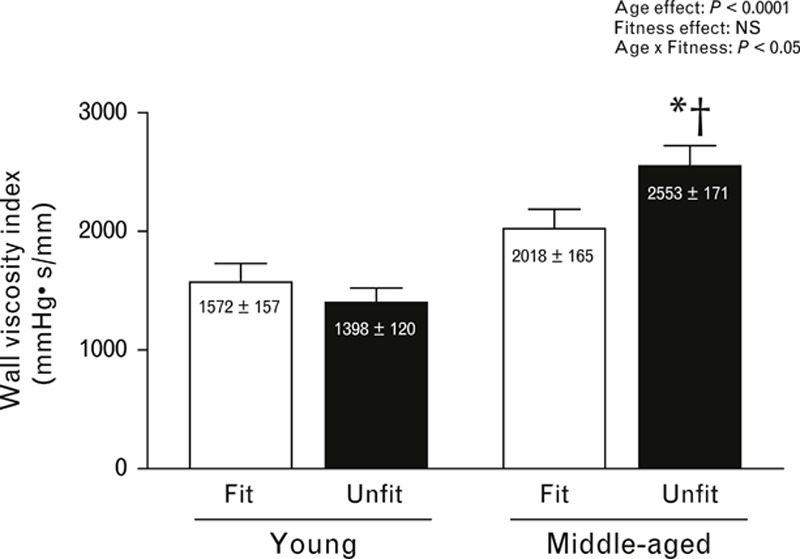
Bar graph showing wall viscosity index in each group. Data are means ± SEM. ∗P < 0.05 vs. young men in the same cardiorespiratory fitness level. †P < 0.05 vs. men of the same age in the cardiorespiratory fit group.

Bar graph showing wall viscosity index in each group. Data are means ± SEM. ∗P < 0.05 vs. young men in the same cardiorespiratory fitness level. †P < 0.05 vs. men of the same age in the cardiorespiratory fit group.