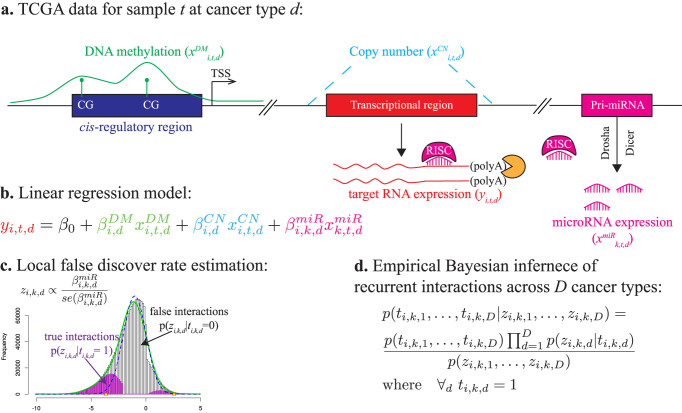
Figure 1. PanMiRa model schema.
(a) Suppose target RNA expression (yi,t,d) in sample t of cancer type d is a function of DNA methylation ( ), copy number (
 ) and miRNA regulation (
 ). (b) The expression change across samples for the target RNA is modelled as the response variable in a multivariate linear regression framework using the input variables as indicted above. (c) The resulting linear coefficient
  indicate the corresponding interaction between miRNA k and target gene i of cancer type d and are transformed into z-scores, which are then subsequently subjected to local false discovery rate (locfdr) estimation18. (d) The joint posteriors for the recurrent interactions given the z-scores are inferred by empirical Bayes using the probabilistic quantities obtained from the locfdr procedure above.

