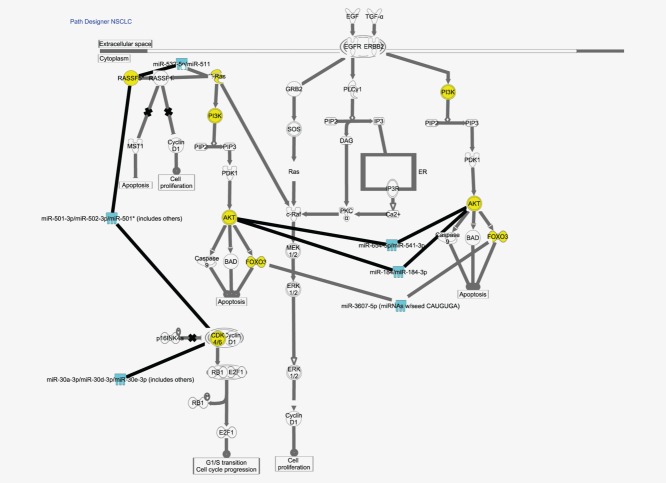
Figure 2.
EGFR pathway in NSCLC from the IPA analysis. The turquoise molecules are microRNAs that were differentially expressed between EGFR-mutated tumors and EGFR wt tumors in our experiment. The yellow molecules are genes that are experimentally observed or highly predicted to be regulated by the highlighted microRNAs.

