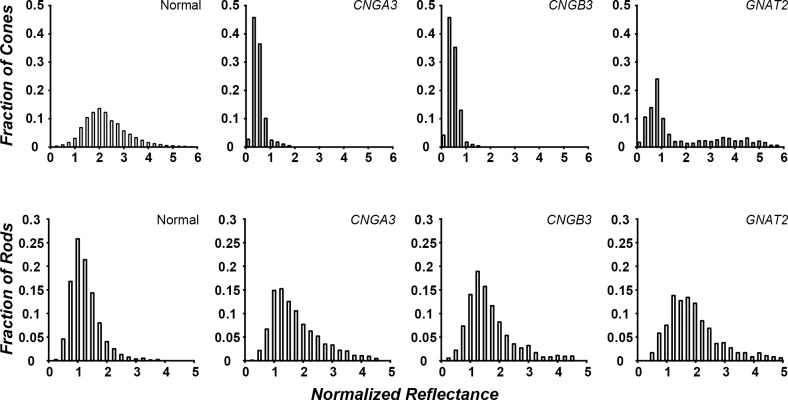
Figure 5.
Genotype-dependent differences in cone photoreceptor reflectance in ACHM. Photoreceptor reflectance was binned and the number of cells was plotted as a fraction of the total number of cells. Data were averaged across subjects by genotype. (Top) Cone reflectivity was variable between genotypes. Subjects with CNGA3/B3 mutations showed, on average, lower reflectance than normal. Subjects with GNAT2 mutations also showed reduced reflectance on average compared with healthy subjects, but greater reflectance and variability than CNGA3/B3. (Bottom) Rod reflectivity was not different from the healthy control in all ACHM genotypes.

