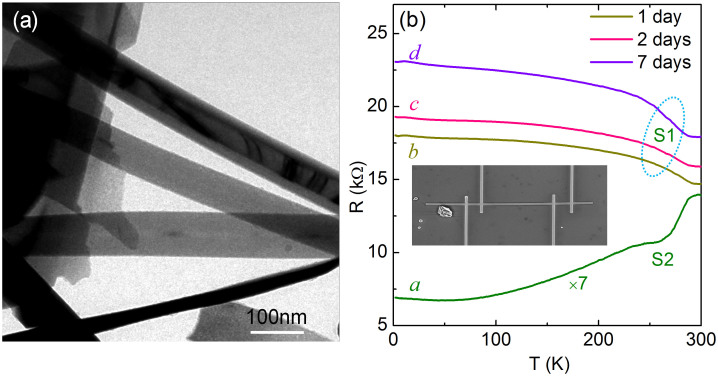
Figure 1. TEM image and temperature-dependent resistance of Bi nanoribbons.
(a) transmission electron microscopy image of nanoribbons. (b) The resistance as a function of temperature of two individual nanoribbons, S1 (curve b) and S2 (curve a) with thickness about 40 nm and 80 nm, respectively, where a metallic behavior can be observed in S2 and a non-metallic can be observed in S1. The curves for S1 after exposed to air condition with 2 day (curve c) and 7 days (curve d) are also shown. The inset is a SEM image of a nanoribbon device for four-probe transport measurements.

