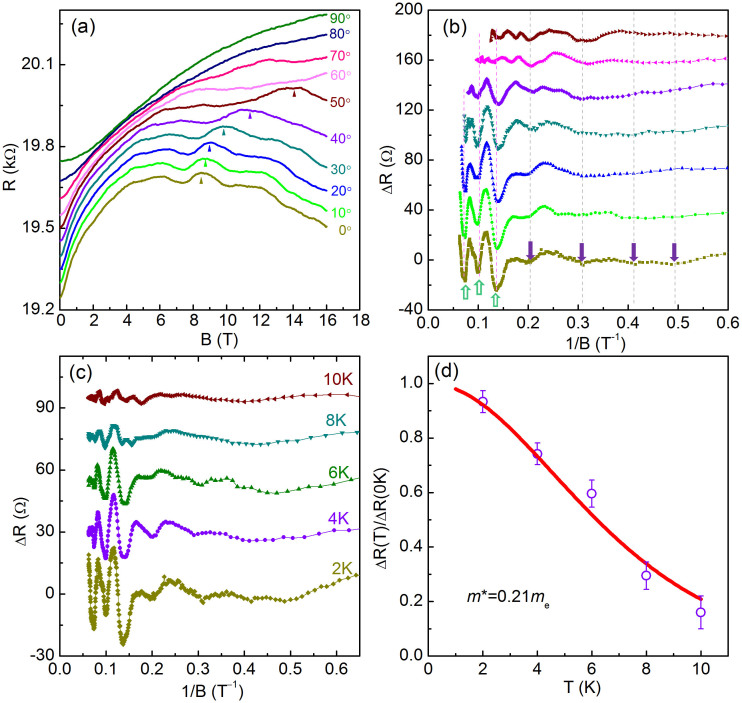
Figure 3. 2D SdH oscillations of Bi nanoribbon S1 (~40 nm).
(a) The resistance of sample S1 as a function of magnetic field at different tilted angle θ at 2 K. The inset is the schematic of B orientation in different planes of nanoribbon. The arrows mark the involution of the peak at B = 8.65 T. Inset: schematic of the measurement setup where θ denotes the angle between the direction of the magnetic field and the current flow in the nanoribbons. (b) Amplitude of the resistance oscillations ΔR versus 1/B⊥. Two sets of oscillation can be identified which were marked by solid and hollow arrows respectively. The oscillation spectra show periodic behavior with 1/Bcosθ, indicating a typical 2D character of electronic structure. (c) SdH oscillations for sample S1 (~40 nm) under a perpendicular B at different temperature; (d) Temperature dependence of the scaled oscillation amplitudes at B = 8.65 T, yielding a effective mass of 0.21 me. The curves were offset for clarity.

