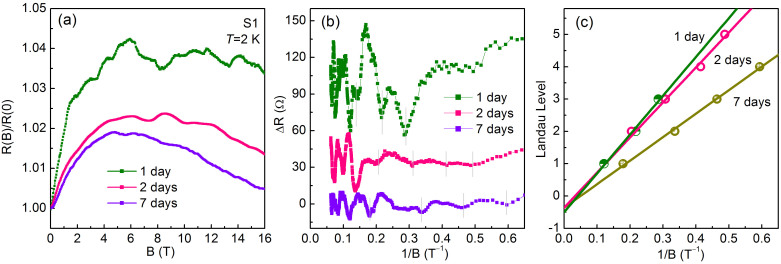
Figure 4.
(a) Normalized magnetoresistance in perpendicular magnetic field of three measurements for sample S1 (~40 nm). The MR oscillations superimposed on the background curves were observed. (b) Amplitude of the resistance oscillations ΔR versus 1/B⊥ for three measurements. (c) 1/B versus the Landau index number, n, for sample S1 with three measurements. The dips of oscillations correspond to n. The solid lines correspond to the best fits to the experimental data.

