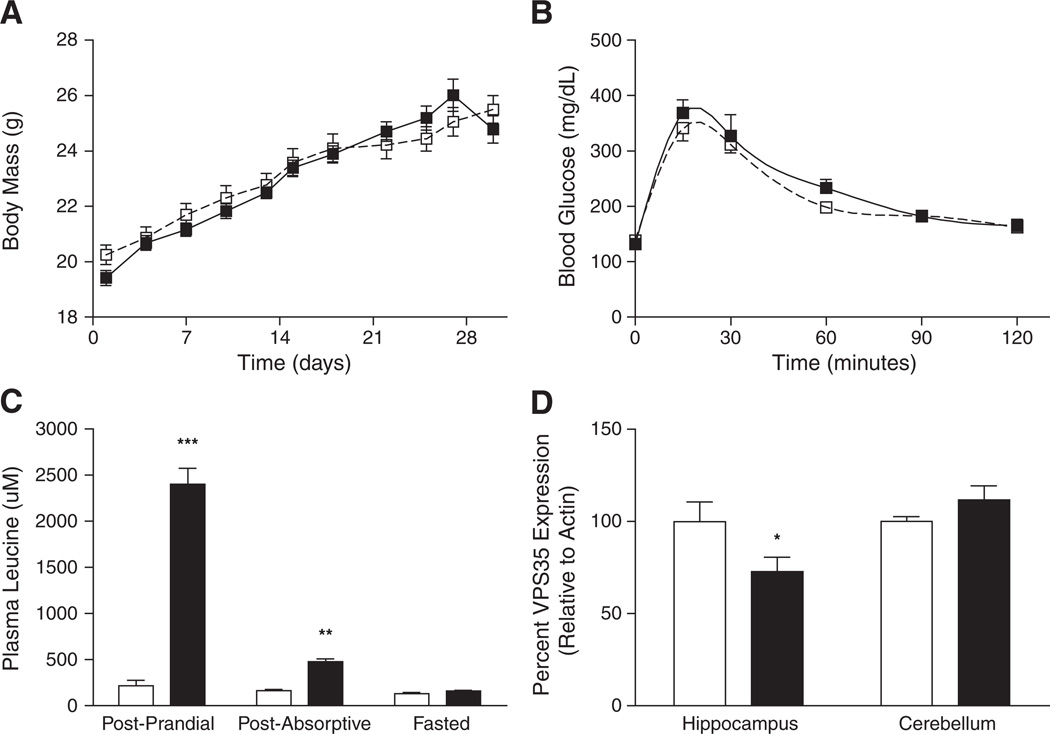
Fig. 2.
Physiological measurements and retromer protein expression in control vs. HLD-fed mice (white vs. black symbols/bars, respectively). (A) Growth curves, (B) glucose tolerance (C) plasma leucine levels, and (D) brain region-specific retromer protein levels are shown for control and HLD-fed mice (mean ± SEM, n = 8 per feeding regimen). *P < 0.05, **P < 0.01, ***P < 0.001.

