
Figure 3.
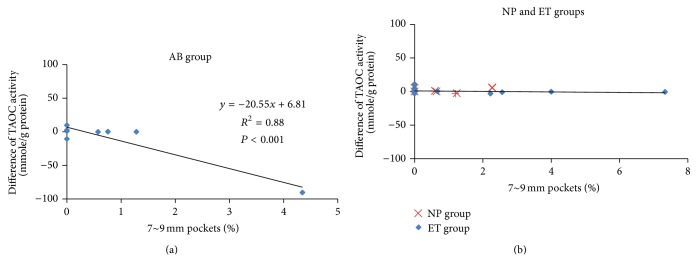
Scatterplots of total antioxidant capacity (TAOC) differences and sum of baseline 7~9 mm pocket percentages. (a) Abandoned (AB) group and (b) nonprogress (NP) group and effective treatment (ET) group.
Official websites use .gov
A
.gov website belongs to an official
government organization in the United States.
Secure .gov websites use HTTPS
A lock (
) or https:// means you've safely
connected to the .gov website. Share sensitive
information only on official, secure websites.
Scatterplots of total antioxidant capacity (TAOC) differences and sum of baseline 7~9 mm pocket percentages. (a) Abandoned (AB) group and (b) nonprogress (NP) group and effective treatment (ET) group.