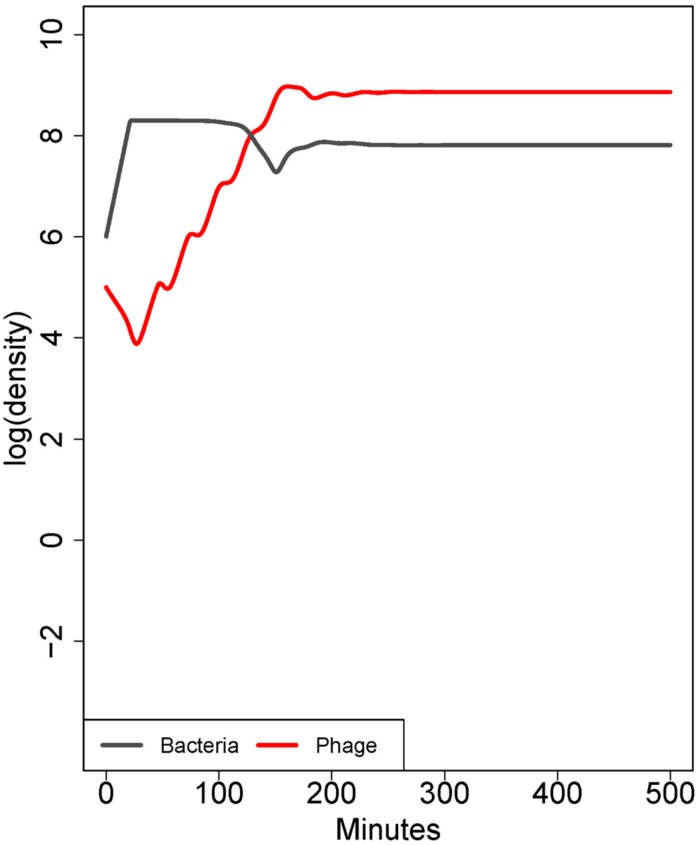
FIGURE 2.
Co-dynamics of bacteria and phage. In contrast to Figure 1, here the population consists of a mix of cell types differing only in adsorption rate (10-9 or 10-10 mL/min). Initially, there is a 50-fold excess of cells with the higher adsorption rate, but there is a low rate at which each cell type is converted into the other. The phage ascends rapidly because most of the cell population has a high adsorption rate. However, bacterial densities are only mildly affected because the low-adsorption population displaces the high adsorption rate population. The result is paradoxical because the phage population ascends as if it will kill well, yet bacterial densities show only a slight depression; similar dynamics are seen in the case of a subpopulation of cells occupying spatial refuges. The model in this figure corresponds to the ‘intrinsic’ phenotypic resistance model in Bull et al. (2014). Parameters are otherwise the same as in Figure 1.

